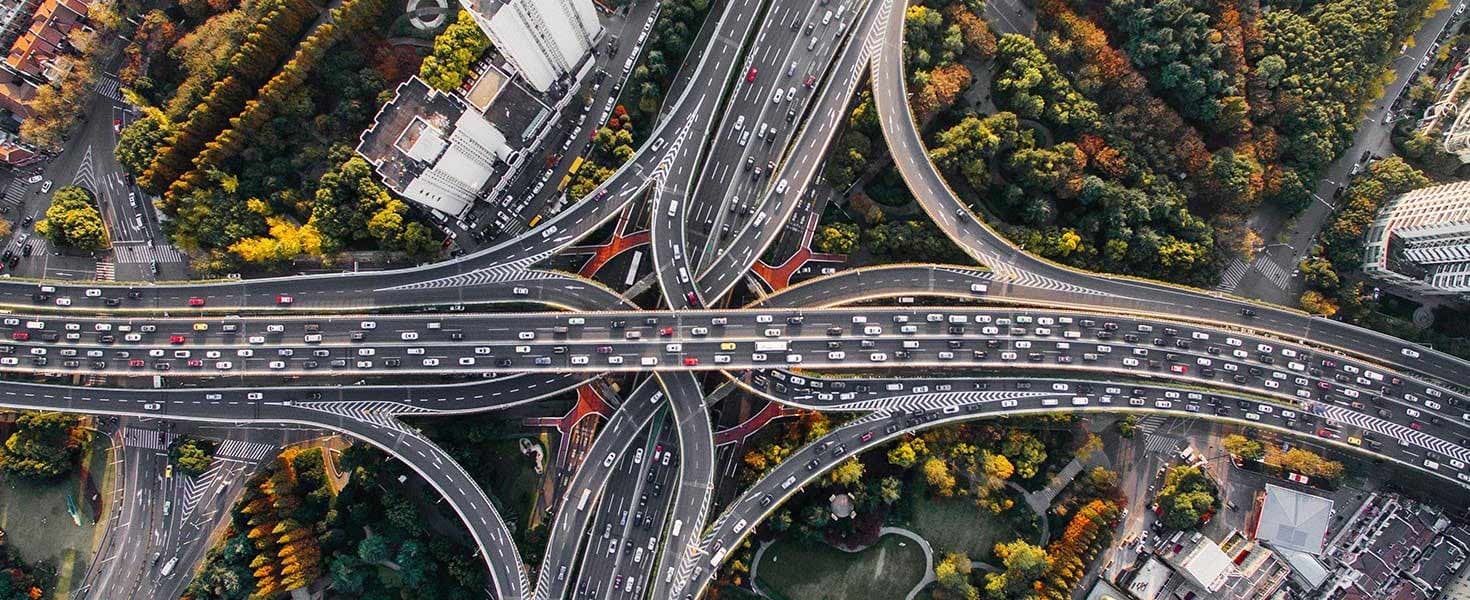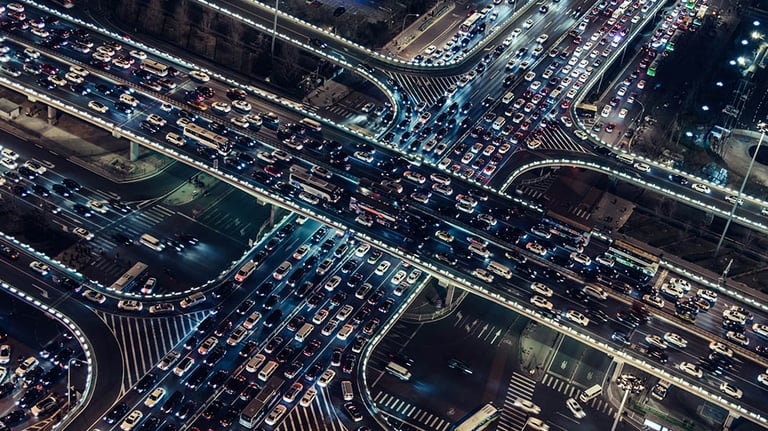

For the average American commuter, traffic and congestion are incredibly important. They are so important that they often help us determine where we buy homes and lay down roots in our communities. Commuters understand the toll traffic takes on our daily lives, impacting our mental well-being as well as our wallets.
In 2018, an INRIX study found that the average American driver lost 97 hours each year at a cost of $1,348 due solely to traffic and congestion, or roughly $87 billion nationwide. That same study also found that Boston, MA was the most congested American city, averaging 164 hours lost in traffic per driver each year and Portland, OR to be tenth, with just 116 hours lost per driver.

According to AAA, the national average for a gallon of gas is $2.32. While cars idling in traffic can use up to ¾ of a gallon an hour, this is just a fraction of the true cost of congestion to commuters. The stop-and-go lurching of bumper-to-bumper traffic takes a hidden toll on vehicle parts. With each lurch, strain is put on engines and friction applied to brake pads that wears them down. Over time, a car driven primarily in bumper-to-bumper traffic compared to a car driven primarily at speeds of 35 mph or greater will show vastly different degrees of wear and tear across the mechanical spectrum.
A 2019 study by the American Transportation Institute analyzed commercial vehicle traffic congestion across America’s entire highway system and identified key “bottlenecks” nationwide. In the top 10 worst bottleneck corridors, average truck speeds dropped by 9% annually as congestion worsened year over year. Some experts point to crumbling infrastructure and slashed budgets as contributing factors, while others see an increase in the number of drivers and commercial vehicles on the road as the culprit. Ultimately, consumers shoulder the burden of increased delays in more expensive goods from retailers.
Clearly, the costs of traffic are complex and have been for many years, but what of the COVID-19 pandemic and its effect on the traffic landscape post 2020? Obviously, with the pandemic still developing, it isn’t entirely clear how lockdowns, shifting work from home trends, and remote learning will impact traffic in the long run, but in the short term, initial studies have shown significant changes.

A study by Geotab Data & Analytics looked at stoplight and intersection stop-time data in major metro areas across the U.S. Prior to March 2020, commercial vehicles in New York City spent an average of 42 seconds stopped at an intersection during the week compared to 37 seconds on a weekend. As COVID-19 has taken shape, Geotab notes a blending of numbers, with vehicles spending an average of 37 seconds stopped regardless of what day of the week it is. This trend was repeated in major cities like Chicago, Atlanta, and Los Angeles as well.
With rush hour all but evaporated in most major cities, it remains unclear how long current trends will last and which will prove to be temporary adjustments. Commuters could decide the working-from-home life suits them, giving up their daily commute and reducing strains on the roads. Conversely, drivers may joyously re-embrace their daily commutes as a return to normalcy, clogging the roads with commuters simply glad to be back out on the road again. Only time will tell.
